Skew-T Diagram
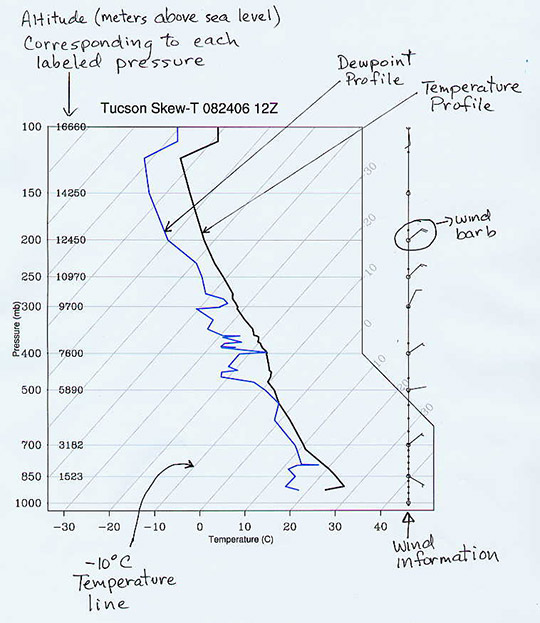
Skew-T Diagrams get their name from the temperature lines on the plot, which are “skewed” at a 45˚ angle. The lines that show the pressure are drawn horizontally, and the space between the lines shows the changes in the density of the atmosphere.
These diagrams provide a snapshot of the vertical structure of the atmosphere. By displaying the temperature, dewpoint, pressure and wind information, meteorologists are able to determine what is the current state of the atmosphere and what weather conditions (such as thunderstorms and tornadoes) are possible.