WeatherSTEM Fusion!
Goal 3: Compare & Contrast
Using the temperature sensor data from the WeatherSTEM unit at your school or the school closest to you compare and contrast the data from your thermometer.
- Watch the video tutorial on how to data mine from your WeatherSTEM unit.
- Data mine in table format.
- Record the WeatherSTEM data from the same time data as your thermometer on your lab sheet.
- Create a bar graph from the WeatherSTEM data.
- Complete the STEM challenge questions from your “Thermometer Lab Sheet.”
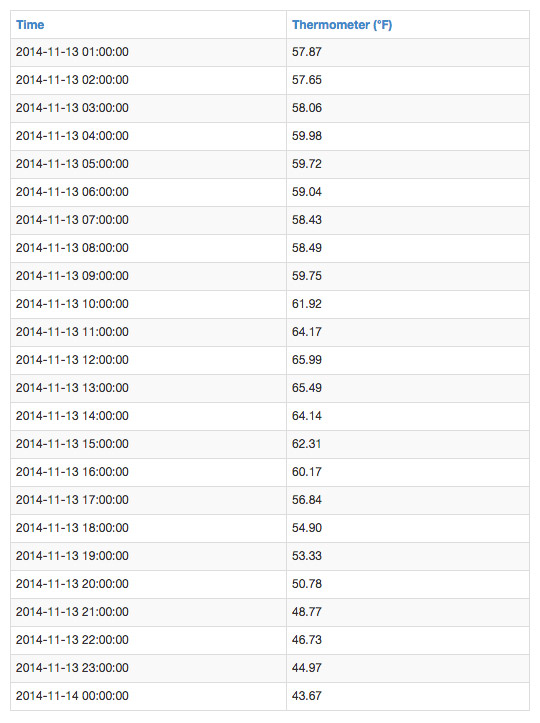
Table view of thermometer data from a WeatherSTEM unit. Shows average temperature by the hour over a 24-hour time period.
Below are three tutorials to help you use WeatherSTEM. There are introductions to the main page, the station page, and the data mining page.