Monitoring ENSO
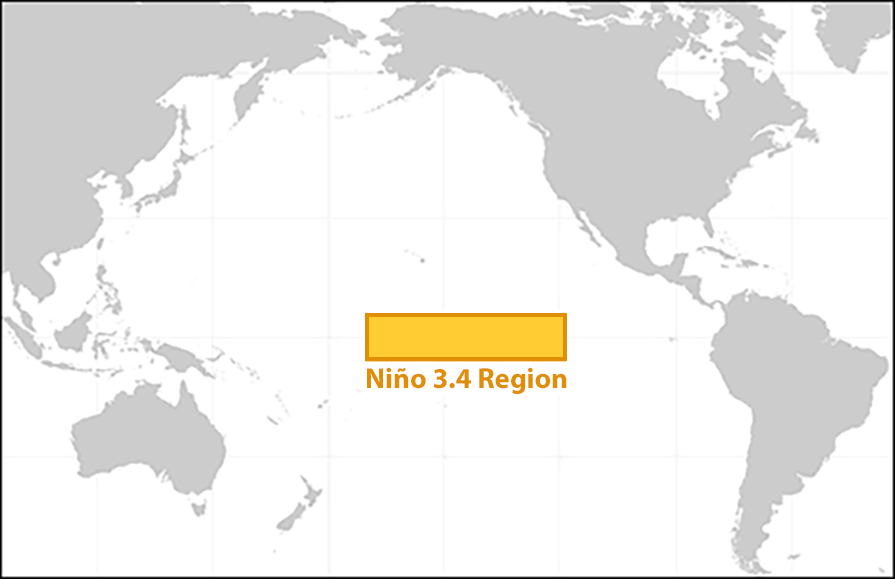
The region spans a swath from 5°N to 5°S latitude and 120°W to 170°W longitude. Source: Niño Region Map | Climate.gov
The shaded rectangle shows the region of the Pacific Ocean where the observed sea surface temperature is compared to average sea surface temperature. Data collected by two main methods:
- Buoys: directly measure the sea surface temperature
- Satellites: indirectly measures how height of the water changes due to the expansion of warm water
Sometimes, research vessels that pass through the area will also take observations. The National Oceanographic and Atmospheric Administration (NOAA) uses this information monitor the current phase of ENSO.