How Do Gyres Affect Climate?
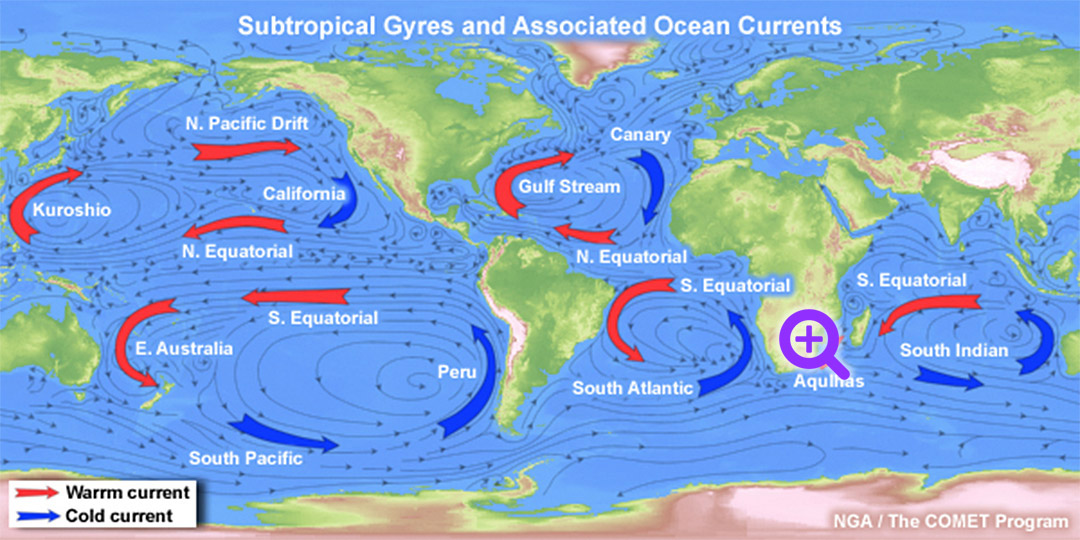
This map shows cool surface currents in blue and warm surface currents in red. You can see that currents on the west side of the continents are cooler and currents on the east side are warmer. This sets up wind and weather patterns, which greatly affect the climate and biological productivity of each continent.
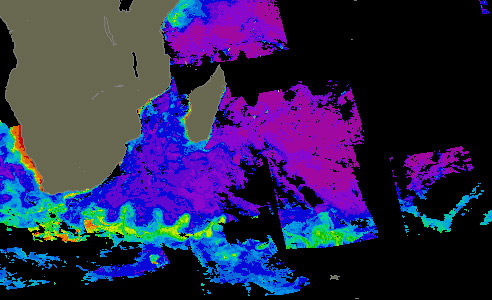
Click the magnifying glass icon on the map for an example of this interaction off the coast of Africa.

Source: Ocean Gyre | National Geographic
