River Gauge Data
The two graphs shown below are called hydrographs. Hydrologists (a person that studies water and its interaction with the Earth), use hydrographs to monitor the discharge of a river at a particular fixed point with respect to time. Discharge is the volume of water flowing past a location per unit time (usually in cubic feet per second (cfs)). Both of these hydrographs are from rivers located in North Carolina. The extensive amount of rainfall from Hurricane Matthew caused the rapid rise of river systems across portions of the Southeast, creating disastrous flooding in areas that were inland from the coast.
The color code helps identify the intensity of flooding or potential flooding along the river:
| Color Code | Description |
|---|---|
| Yellow | Near Flood Stage - flooding becomes a concern. River/stream is approaching or is forecast to approach the gage height (flood stage) where flooding is defined to begin. Flood stage is an established gage height for a given location at which a rise in water surface level begins to create a hazard to lives, property, or commerce. |
| Orange | Minor Flooding - minimal or no property damage, but possibly some public threat. |
| Red | Moderate Flooding - some inundation of structures and roads near stream. Some evacuations of people and/or transfer of property to higher elevations. |
| Violet | Major Flooding - extensive inundation of structures and roads. Significant evacuations of people and/or transfer of property to higher elevations. |
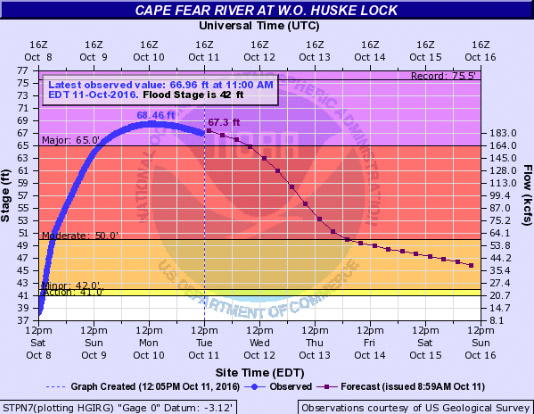
Cape Fear, NC. Source: NWS | NOAA
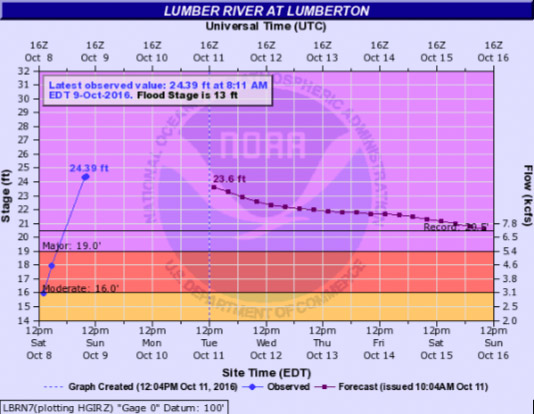
Lumberton, NC. Source: NWS | NOAA