Tidal Gauge Information
Many factors contribute to the intensity of the storm surge at a particular location. High tide, the slope of the land, and bathymetry (topography of the ocean floor) all play a role, but storm surge is primarily caused by the wind. The wind direction has a significant impact on storm surge. The water is pushed in the direction the winds are blowing, so if strong winds blowing towards the coast, this will help push water towards the shore. This piling up contributes to most of the coastal flooding.
These tidal gauge data charts from Fernandina Beach, FL (Nassau County) and Charleston, SC (Charleston County) show how Hurricane Matthew impacted the observed water levels at both locations. The blue line represents the what were the predicted (or forecasted) water levels from October 6th through October 9th. The verified observed level at Fernandina Beach on the afternoon of October 7th was 10.728 ft, which was 5.28 ft. above the predicted value (5.5 ft.). In Charleston, the predicted water level was 4.374 ft.t for the early morning hours of October 8th. The tidal gauge observed a water level of 9.283 ft., nearly 5 ft. above the forecasted value.
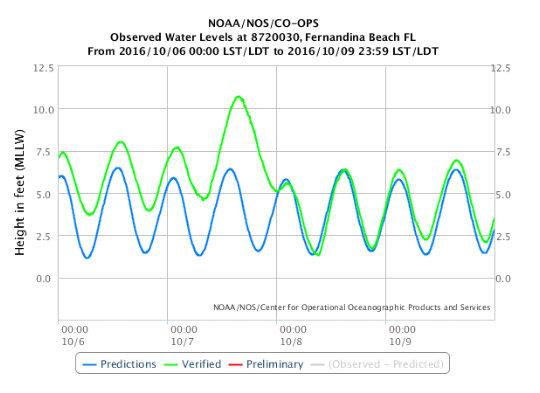
Fernandina Beach, FL. Source: Tides & Currents | NOAA
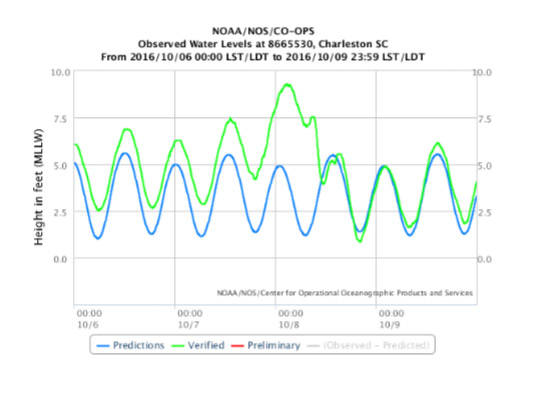
Charleston, SC. Source: Tides & Currents | NOAA