What Do the Data Say? Sunspots
This figure summarizes sunspot number observations. Since about 1749, continuous monthly averages of sunspot activity have been available and are shown here in blue. Prior to 1749, sporadic observations of sunspots are available and are shown in red.
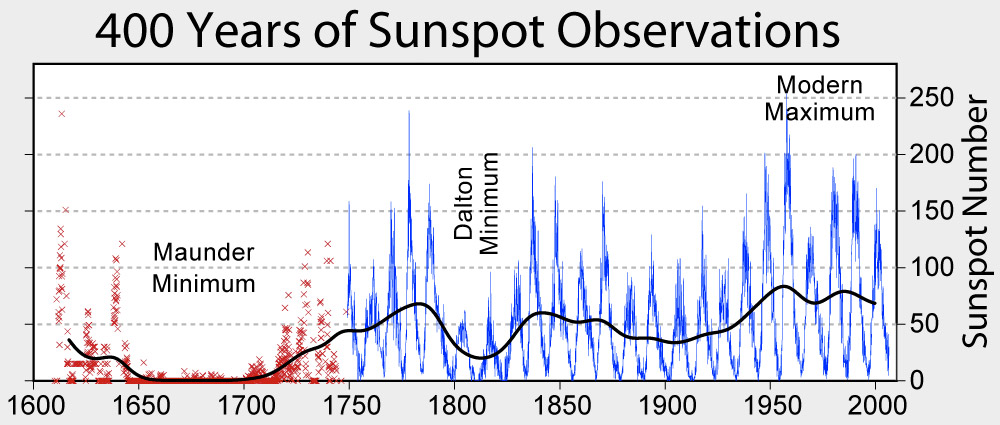
Source: 400 Years of Sunspot Observations | WikiMedia
Notice how the most of the graph shows the very regular 11-year pattern of increased and decreased sunspots, but the period between 1650 and 1700 is characterized by very little sunspot activity. Think about how this may have affected the Earth’s climate during that time.