Seasonal Changes in Carbon Dioxide
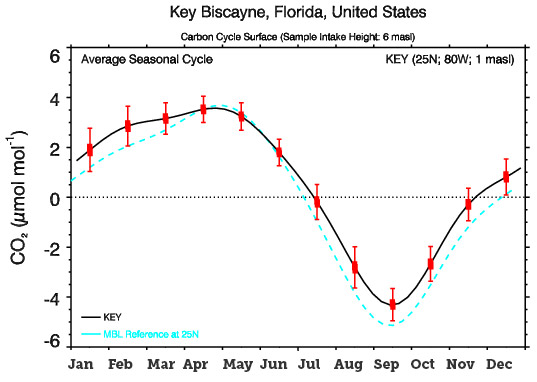
When studying graphs of carbon dioxide over the course of a year, you can see that carbon dioxide increases and decreases with the seasons. On this graph of data collected in Florida, atmospheric carbon dioxide is highest in the winter and spring and then decrease in the summer and fall. What might explain this pattern?
